Analyzing Menu, Sales, and Performances
 Restaurant managers need to make logical decisions to run the business smoothly. However, it is not easy for many cases.
Let’s say you need to decide how much food ingredients to purchase. To make the decision, you should predict the number of customers and which menu they would choose. Probably the most reliable way is to use the historical data – you may use last week’s sales data.
NPOS analyzes your sales data and visualize key information to assist you make right decision as fast as possible. We will illustrate how to use Dashboard+ function in the following paragraph.
Navigating to Dashboard+
[1] Click Setting  .
.
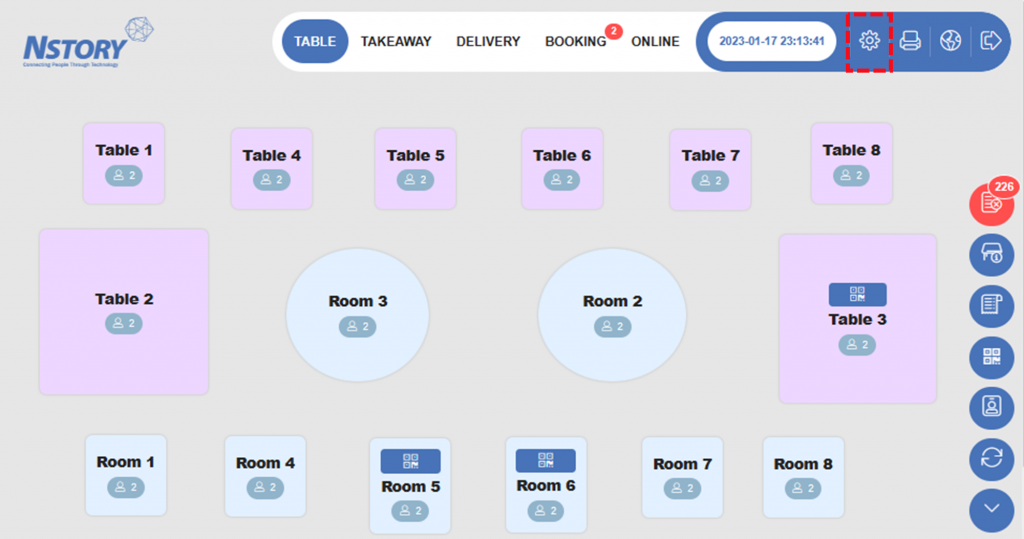
[2] Click Dashboard+  .
.
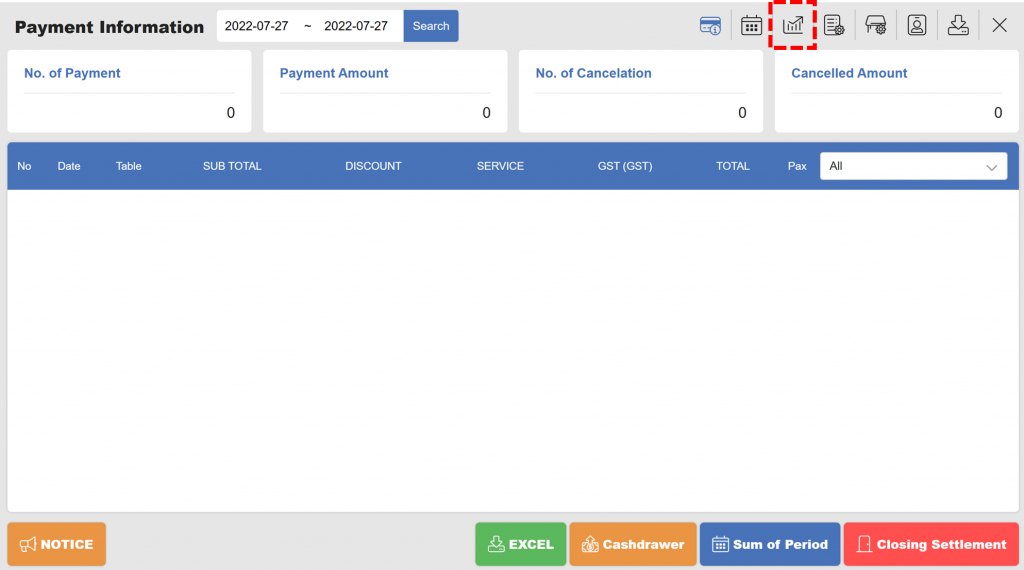
[3] You are now on Dashboard+ page. Specify period to open data and click search.
Exploring Dashboard+
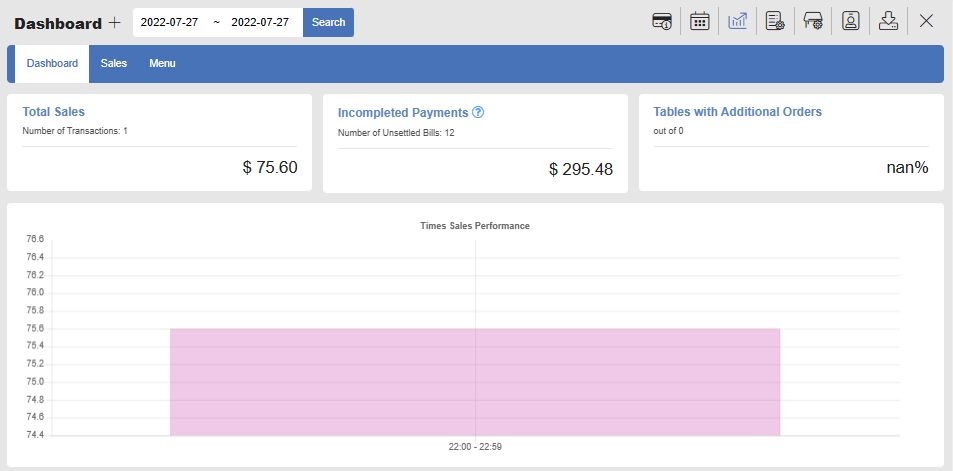
Once you specified a period and click Search, you will get at-a-glance view of key information of your business with charts.
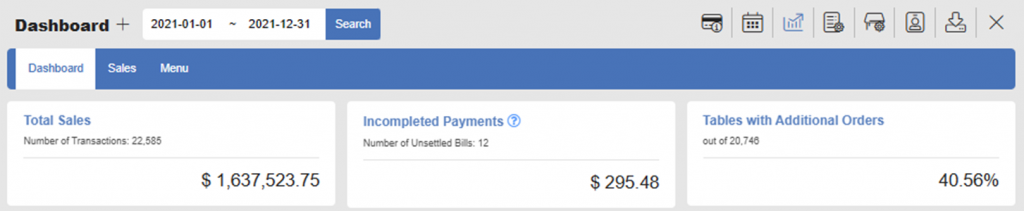
- Total Sales :
Total Sales shows total sales amount with number of transactions. - Incompleted Payments :
Incompleted Payments show number of unsettled bills and amount. - Tables with Additional Orders :
This card shows percentage of tables that made extra orders.
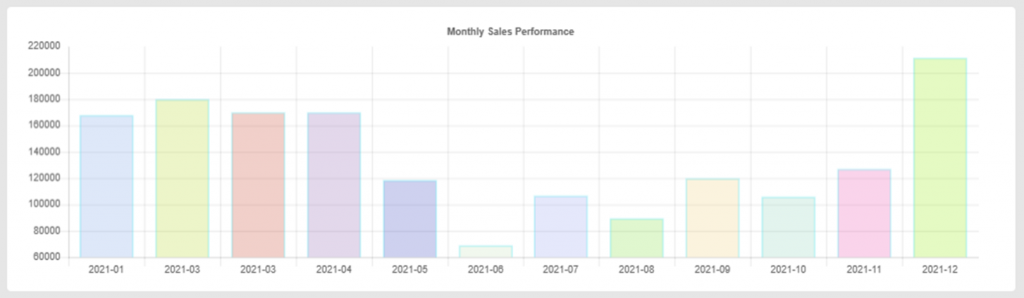
- Monthly Sales Performance :
It shows monthly trends of your sales over time.
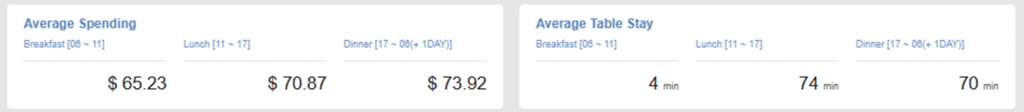
- Average Spending :
Average Spending shows how much customers spent in Breakfast, Lunch, and Dinner. - Average Table Stay :
Average Table Stay shows average time that customers stayed at the table.
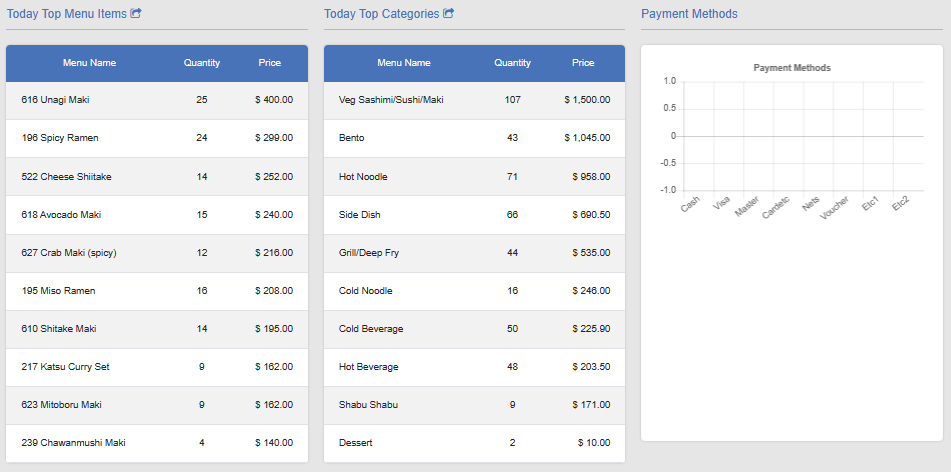
- Top Menu Items
Top Menu Items shows top 10 items by sales amount - Top Catergories
Top Categories shows top 10 categories by sales amount - Payment Methods
Payment Methods shows payment mode with transaction amount
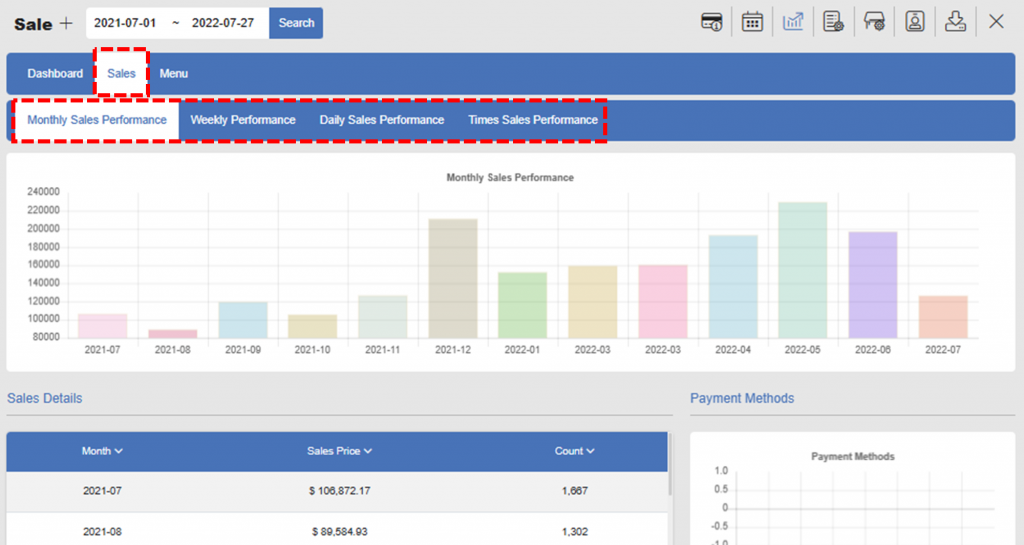
Sales+
In Sales+, you can get Sales Performance data in different basis – Monthly, Weekly, Daily, or Times.
To get the data, click Sales and select basis among Monthly, Weekly, Daily, or times.
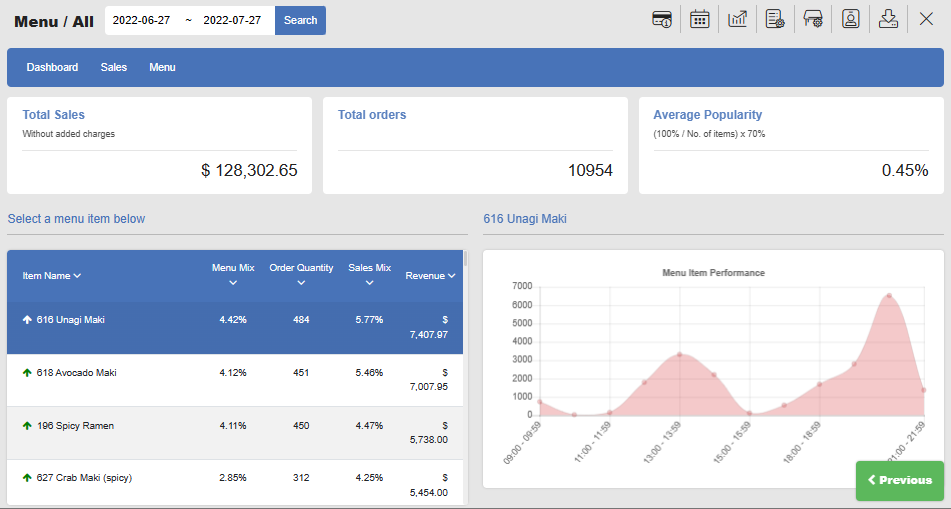
Menu+
In Menu+, you can see each item’s order quantity and revenue by items.
Click Menu and Category. Click All if you want to display all items regardless of category.
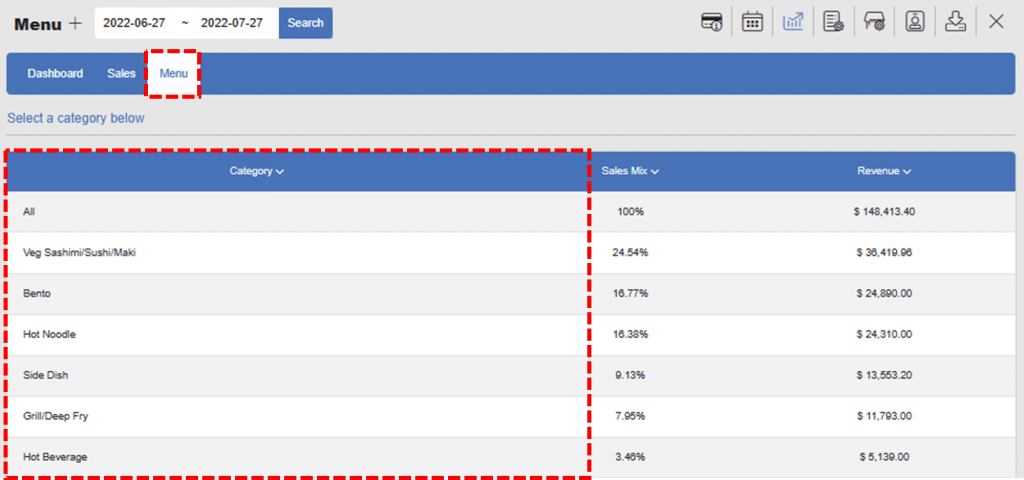
Check the sales data.
Related Page
◀️ Go back to Training for Manager
◀️ Go back to NPOS Manual
Last updated on 29-Jan-2023

2 Replies to “Analyzing Menu, Sales, and Performances”